Simple steps to great diagrams

Diagramming skills are really important for your team, employer and career was the message I wanted to share previously. As promised in that post, this is the hands-on follow-up guiding you down the path of good diagrams.Scenario
I’d love to show you an example of some real diagrams that I created for systems that I work on, but that’s not going to go down well. Instead, I picked this job spec from Stack overflow, and decided to design a system loosely based on it.
What we have then is a sports trading platform that needs to meet these functional requirements:
- Provide a website allowing users to view in-play odds for major sporting events
- Prove an API allowing business users to share with their customers in-play odds for major sporting events
- Both website and API need to accept payments (bets)
- Calculate odds that will make the company the most profit
- Customisable parameters for business partners that determine how aggressive the odds will be
- Management application for staff to view details of payments, and manually update events
Additionally, there are some non-functionals that will determine how successful this project is:
Scalability
- High-volumes of traffic and always increasing
- Ahead of major sporting events there will be a massive surge in traffic — the system needs to be able to handle this
Audit
- All transaction data must be kept for 5 years
- Cannot afford to lose data
Performance
- All requests for information must be responded to within 500ms
Availability
- If data is not available the business loses about £3000 a minute
In real-life we would obviously expect a more extensive list of non-functionals.Context Diagram
From the highest level possible, zoomed out to maximum, context diagrams indicate where the system fits into the bigger picture — which systems does it communicate with, and who are the users?
For the sports trading example, I came up with this:
Click to see full size
What’s prominent and purposeful about this diagram is the way it can keep everyone focused on who they are building the system for, and who they rely on. Every day developers will see the diagrams on the wall and feel excited about building a sports trading platform that’s powering applications for some giant sporting brands.
Perhaps more importantly, this diagram is a powerful tool for collaborating with less technical colleagues.
Consider the case when a friend in customer services receives a surge of complaints about payments taking too long. You can show them this diagram, making it easy for them to report to customers: “Cash-blaster process our payments, and they are experiencing technical problems right now”.Containers Diagram(s)
Twist your lens a few degrees, because the containers diagram zooms in a level from the context diagram. This one most definitely is technical.
With a containers diagram, the idea is to show major technological choices, and interactions between “containers” (think applications for now).

Click to see full size
I wouldn’t like to build a system without first establishing this information. Nor would I want to modify an existing application without knowing the important details a containers diagram shows me (not usually much choice).
If I’m going to write code, I really want to know why I’m writing it, and where it fits into the overall technical solution. That’s why context and containers diagrams make me very happy.
Non-functionals
A containers diagram is useful for validating your design against many non-functional requirements. Using this containers diagram, it’s easy for us to explain we can cluster our NServiceBus host at peak times to handle the surges in traffic for major sporting events (that we’ve been asked to accommodate).
Availability of odds & event data is crucial for the business, remember. This containers diagram shows how we plan to (or are already) use clustered MongoDB to address this. It’s not a full-on guarantee, but it can help to validate your ideas (fail fast etc).Component Diagram(s)
Twist the lens a few more degrees, and now we find ourselves just above the class level — we’re in component diagram land.
They are controversial, and might be too much of an implementation detail, but they’re not quite UML. Components are groups of classes, and can be expressed by just boxes and arrows if you like.
An ideal use of component diagrams is when you are doing DDD (domain driven design). In these scenarios you want a strong coupling between your domain diagrams, terminology (ubiquitous language), and your code.
For the sports trading platform, I can see a lot of value in diagrams like the following. Granted, they will be more volatile than containers or components, but that’s inherent to DDD anyway.
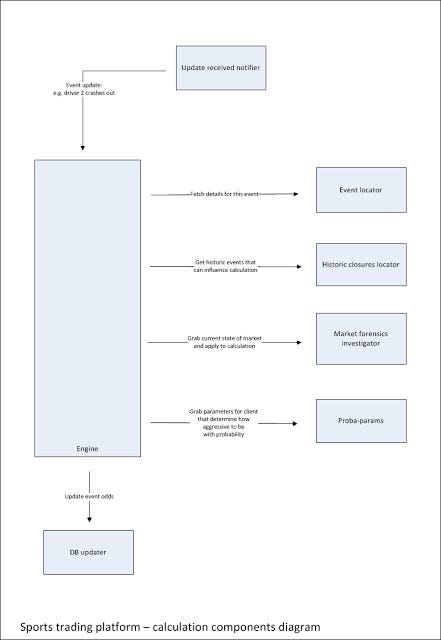
Click to see full size
This diagram has terms like “historic closures”, “market forensics” and “proba-params” which are really important in this domain. In this case we really do want our code to look like this — it’s important if we’re going to keep our domain model — diagrams, terminology and code — consistent.General Tips
Some of the underlying concepts that make these diagrams so effective are:
- Focus on getting the level of detail correct
- Consider the target audience
- Use colour and notations, but make sure they are explained with a nice key
In my experience, you can take these concepts and apply them to any kinds of software diagram you are making.Thanks Simon
I should probably thank Simon Brown after I just ripped off a tiny piece of his course and book. I just really find these diagrams immensely useful for all the reasons I mentioned in the last post and more. These are really important skills, and our lives as developers would be a lot better if we acquired and used them.
There’s still tonnes more you can learn from his course and book though, and not just about diagrams. I’m always referring back to the book as I ponder “how would Simon do it?”.
So, cheers Simon — you’ve helped me a lot.